Shareholder KPIs
Underlying profit before tax
Profit before income tax and non-underlying items as shown in the Group Income Statement.
The Board considers that this measurement of profitability provides stakeholders with information on trends and performance, before the effect of non-underlying items.
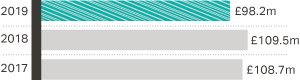
Underlying profit before tax declined by -17.9% year-on-year, primarily driven by mild winter temperatures, weakened consumer confidence, retail cost inflation and investment in strategic projects.
Underlying earnings per share("EPS")
Profit after income tax and before non-underlying items as shown in the Group Income Statement, divided by the number of shares in issue.
EPS is a measure of our investment thesis and as such we aim to manage revenues, margins and invest in long-term growth.
Underlying earnings per share declined by -17.2% year-on-year. See above for explanation.
Underlying EBIT and Underlying EBITDA
Underlying EBIT results from operating activities before non-underlying items. Underlying EBITDA further removes Depreciation and Amortisation.
The Board considers that these measurements of profitability are a viable alternative to underlying profit and uses these measures to incentivise Management.
Underlying EBIT declined by -16.6% year-on-year. See above for explanation. Underlying EBITDA decreased by -10.3% year-on-year.
The above numbers represent Underlying EBITDA
Dividend per Ordinary Share
Cash returned to shareholders as a return on their investment in the Company.
Our prevailing policy is to grow the dividend every year with cover of around 25 underlying earnings on average over time. The impact of adverse FX movements will reduce cover temporarily until fully mitigated, which will take some time.
The Board has recommended a final ordinary dividend of 12.39 pence per share (FY18: 12.03 pence), which, if approved, would take the full-year ordinary dividend to 18.57 pence per share, an increase of +3.0% on the prior year. Our dividend cover would reduce to c.1.35 for the full year, however this is expected in the medium-term as we invest for sustainable long-term growth, moving towards 2 times over time.
Free Cash Flow
Adjusted Operating Cash Flow less capital expenditure, net finance costs, taxation, exchange movement and arrangement fees on loans.
Our medium-term target is to grow Free Cash Flow over the next three years (FY19 – FY21) compared with the previous three years (FY16 – FY18)
For the year, the Group had Free Cash Flow of £42.7m up +2.9% year-on-year.
Net Debt to Underlying EBITDA ratio
Represented by the ratio of Net Debt to Underlying EBITDA.
We currently continue to target a ratio of 1.0x, with a range of up to 1.5x to allow for appropriate M&A. We will arrive at the debt target over time. This ratio helps to compare the financial result for the year to debt levels.
The Group had a Net debt to underlying EBITDA ratio of 0.8 times at the end of FY19.
Like-for-like sales
Revenues from stores, Autocentres and websites that have been trading for at least a year (but excluding prior year sales of stores and Autocentres closed during the year) at constant foreign exchange rates.
Like-for-like sales is a widely used indicator of a retailer's trading performance, and is a comparable measure of our year-on-year sales performance.
Group like-for-like sales performance of +1.1%. Retail +0.8% like-for-like and Autocentres +2.6%. In Retail, motoring has been affected by mild winter temperatures which has correspondingly benefitted cycling.
| FY19 LFL revenue movement |
|---|
| Halfords Group | +1.1% |
| Retail | +0.8% |
| Motoring | -0.4% |
| Car Maintenance | -1.1% |
| Car Enhancement | -0.6% |
| Travel Solutions | +1.7% |
| Cycling | +2.6% |
| Autocentres | +2.6% |
Operational KPIs
Service-related Group sales growth
Service-related Retail sales is the income derived from the fitting or repair services themselves along with the associated product sold within the same transaction.
To grow service-related Group sales faster than total Group sales growth.
Service-related Group sales grew faster than overall sales, up +1.6% in the year and represented 24% of overall group sales. We have added new services, taking the total in-store offering to over 80 services across motoring and cycling.
Group Colleague Engagement
The proportion of Group colleagues who respond positively to the questions in the Colleague Engagement Survey.
We aim to improve Colleague Engagement across the Group with specific focus on required areas identified by colleagues.
Our Group Colleague Engagement for FY19 was at 79%, a fall of 2% on the previous year but is still ahead of the Retail benchmark.
Customer Net Promoter Score ("NPS")
Measure the changes in NPS of our Retail stores and Autocentres.
We are committed to improving the score with our customers across the Group.
Retail NPS was 62.9 down 0.8 points from the previous year. This was the first full financial year in which Autocentres measured NPS – it achieved a score of 65.6.
Retail FY19:
62.9
Retail FY18:
63.7
Autocentres FY19:
65.6